
This month, we’re excited to announce a new integration with Splunk. This integration allows you to send message audit data to Splunk in real-time, allowing integration of insights from this data into your wider SIEM processes. As with the similar “remote syslog” functionality, we’ll send data about each message as it arrives, updates with each delivery attempt, and further updates for any training users do for misclassified messages.
Splunk Integration
In their own words:
The Splunk platform removes the barriers between data and action, empowering observability, IT and security teams to ensure their organizations are secure, resilient and innovative.
“About Splunk”, https://www.splunk.com/en_us/about-splunk.html, retrieved June 16th, 2022
At N-able, we’re fans of Splunk, and we know many of our partners are as well. SIEM tools like Splunk rely on users providing the tool with the right data to be able to achieve observability goals and take action when needed. Email is a huge part of most businesses, so data about the email flowing through to and from your customers needs to be available in your SIEM solution. We’ve had the ability to send data to SIEM tools for a long time, via a “remote syslog” feed, but we’ve upped the game with this release, for Splunk users, with a dedicated integration that’s so simple to get started with that we’re confident that all our partners using Splunk will be jumping on board immediately, and those that aren’t using Splunk will be thinking about checking it out.
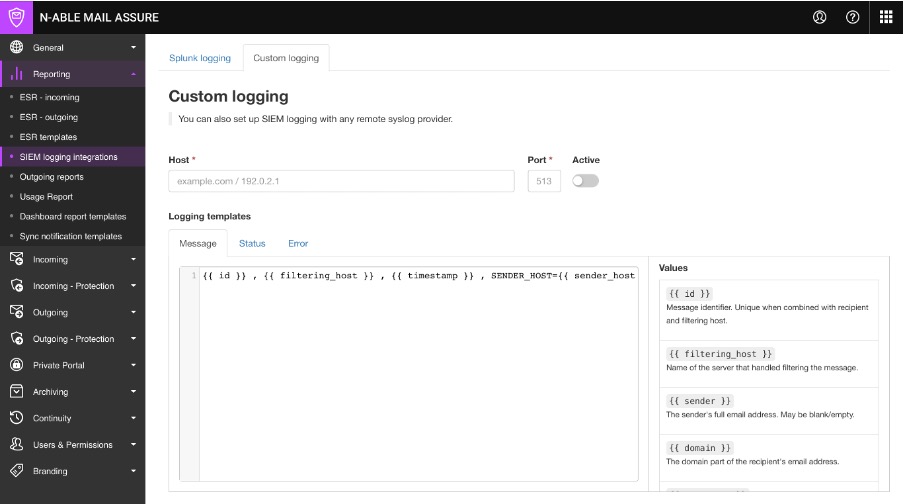
Configuring Mail Assure to send message audit logging to Splunk is simple. Navigate to the “SIEM logging integrations” page, enter the hostname and port of your Splunk server and a token for the HTTP Event Collector, and activate the feed. You can also send a test event to Splunk to verify that everything is working correctly – we recommend that you do this and then locate the event in Splunk to ensure data is received (note that right now it’ll be sent to the default index for the token, rather than the one specified, but this will be fixed in an upcoming release). You may also optionally choose an index that Splunk should use for the data – if this is left blank, then the default index for the token (as configured in Splunk) will be used.
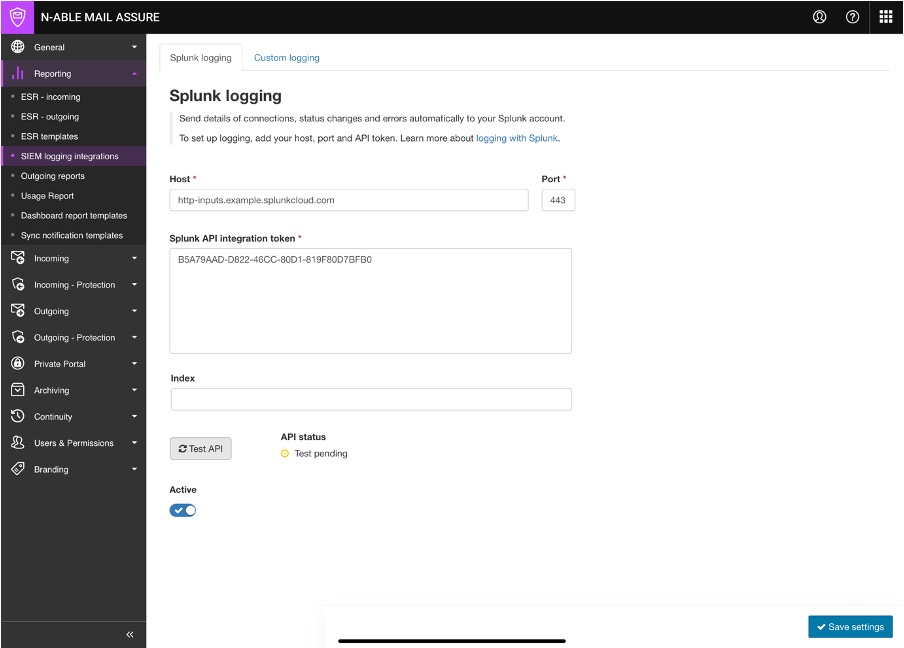
Unlike the remote syslog feed, there’s no need to configure a template for the data – it’s sent in a structured format to Splunk, so Splunk will automatically take care of indexing the data appropriately.
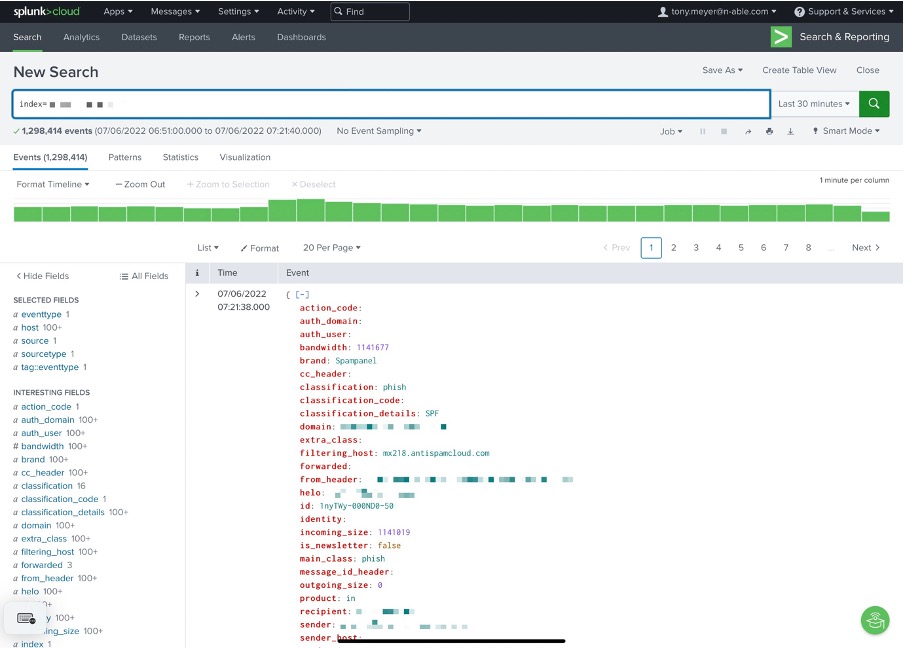
Once your message audit logs are flowing into Splunk, you have all the power that Splunk offers to build insights into the mail and mail-borne threats that your customers are receiving and sending.
Splunk will automatically surface interesting fields and show you event volume and patterns, even when just querying the index:
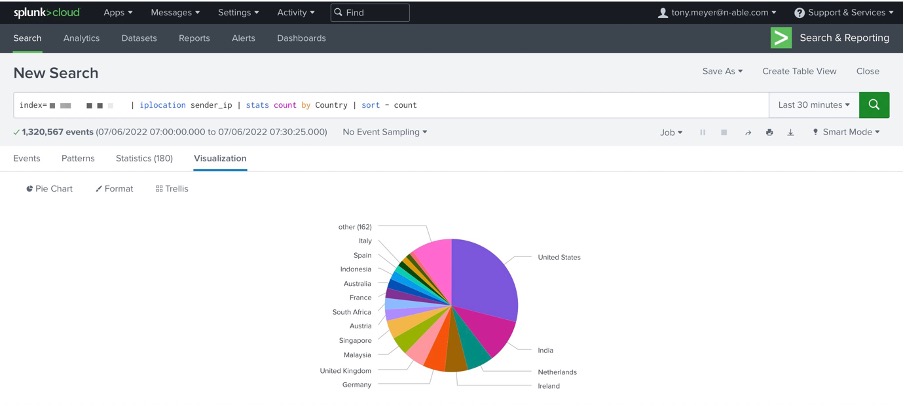
It’s trivial to have Splunk produce charts – for example, showing where your traffic originates (based on the sender IP address):
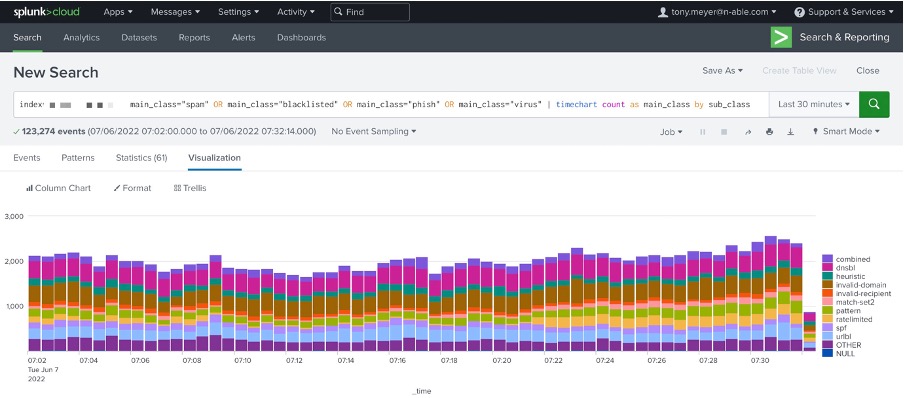
If you want charts showing how much mail is blocked, broken down by classification, with more flexibility than available inside the Mail Assure app, Splunk has you covered:
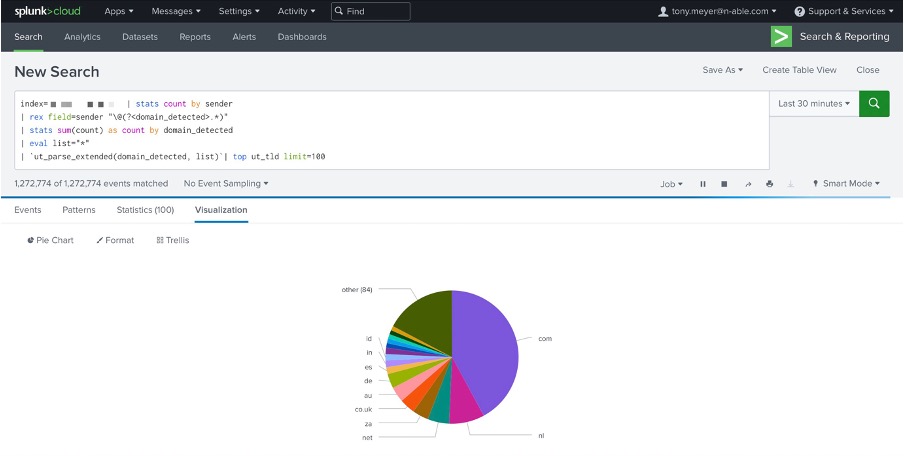
More complex queries are also possible, like this chart showing the most common top-level domains across mail:
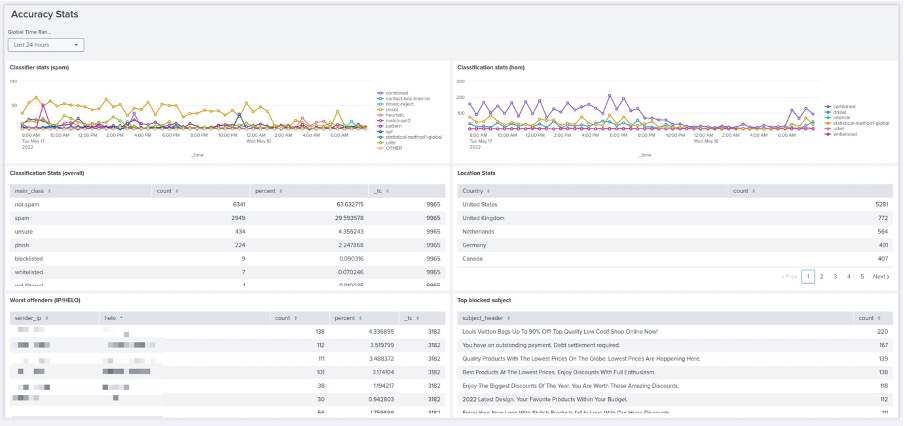
In Splunk, you can save queries, generate alerts based on queries, and build dashboards based on the Mail Assure data, such as this simple accuracy dashboard:
If you build reports or dashboards in Splunk that provide you with a lot of insight and value, we’d love to hear about it! Let your N-able contact know, drop us a note in the Elite Partners Slack, or just drop a note to the support team.
Remote Syslog Feed
As part of introducing integration with Splunk, we’ve renamed the navigation menu item from “Remote Syslog Feed” to “SIEM logging integrations”. The remote syslog functionality is still present, under the new “Custom logging” tab. We’ve made some minor adjustments to the layout of this page, but the underlying functionality is unchanged and your existing feeds will continue to work with no adjustments required.
Changelog
Since the last major release, we’ve also fixed the following issues:
• Delays in message audit log entries (and updates to entries, such as from later delivery attempts) should be significantly reduced. A change in a TLS library used in late August 2021 caused periodic degradation in the queue processing system, resulting in regular delays, particularly during peak traffic periods. Now that the underlying issue has been resolved, we are focusing on improving our processes so that we are able to resolve issues like this far more quickly.
• MMA-7055, #2385. The available context variables for Private Portal templates have been corrected.
• MMA-7086, #3884. Fixed an issue that could cause the “Unrecognised Domains Log” page to display an error when used.
• MMA-6631, #3905. Fixed Private Portal to properly select the notification template.
• MMA-7153. Fixed an issue preventing creating new (deprecated) Protection Report templates.
We’ve also made the following improvements:
• MMA-6636, #93. The “Add Domain” wizard now includes links to documentation on the final page to help users with the next steps to take to complete onboarding (outside of the Mail Assure app).
• MMA-6796, #58. If an error occurs in the Private Portal app, the user is prompted to provide context around the issue as part of the automated error reporting process.
• MMA-7060. The example links in the control panel API documentation now use https rather than http.
• MMA-6706, MMA-7143. Improved the speed of loading messages in the Private Portal app.
You must be logged in to post a comment.