
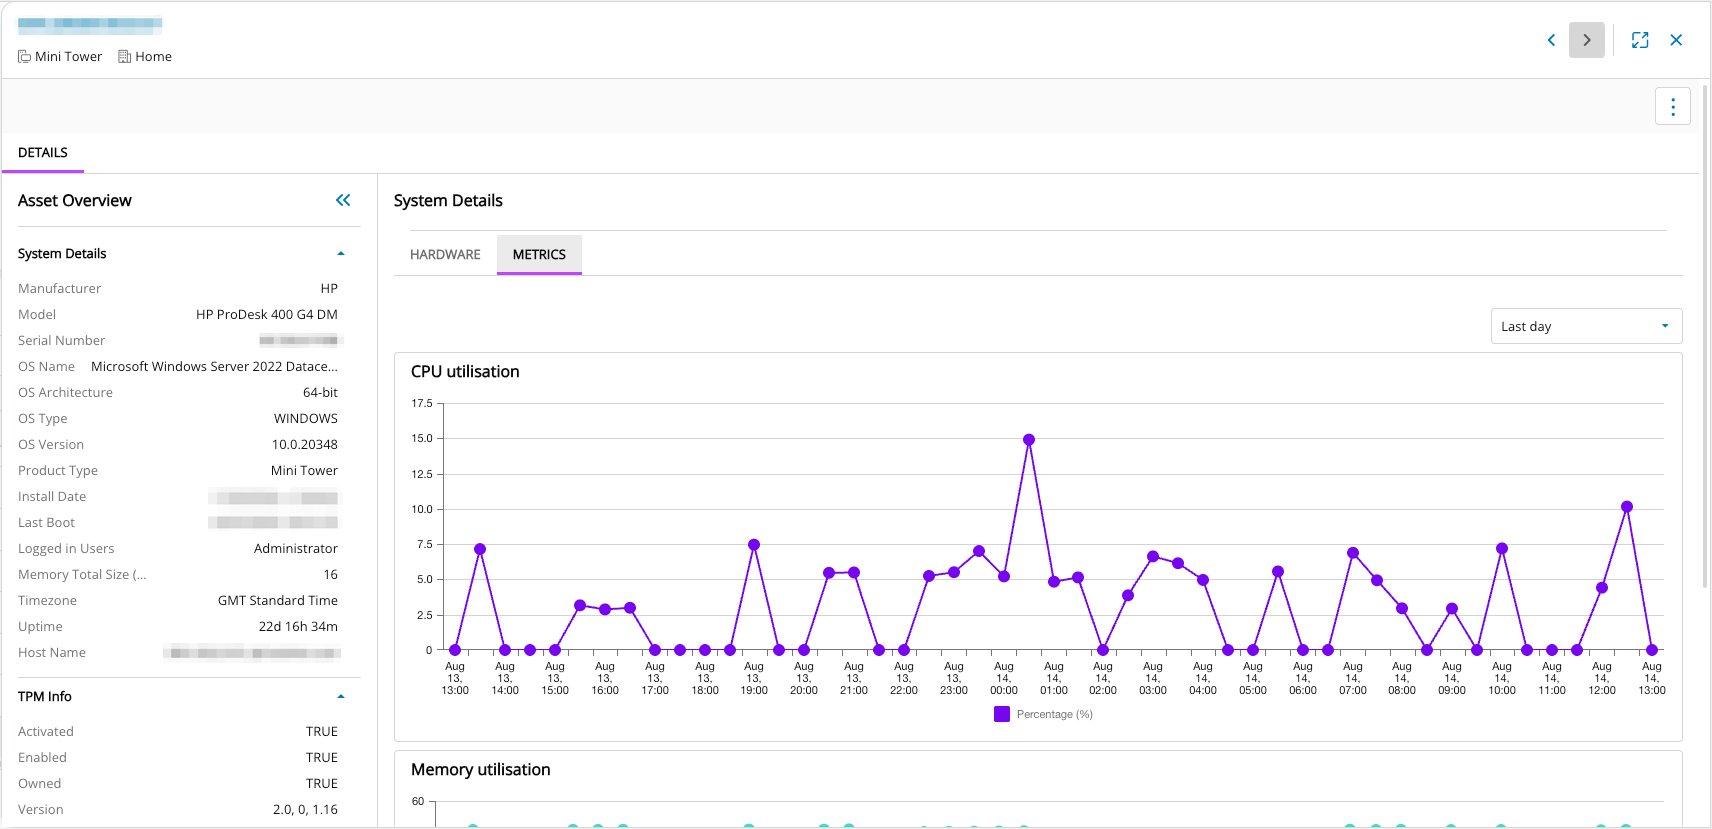
We are pleased to announce the availability of new Asset Metrics showing CPU and Memory usage for both N-central and N-sight! To see the new feature, go to Assets View, open the Asset Details panel for that asset by clicking anywhere on the asset row, then click on the Metrics subtab to see the new CPU and Memory usage graphs.
Asset Metrics is of high value for both L1 and L3 Technicians because it accelerates issue resolution, reduces escalations, and improves service quality by providing actionable insights into device performance. This empowers L1s to resolve more tickets independently and equips L3s with the context needed for efficient deep-dive investigations—ultimately driving operational efficiency and enhancing customer satisfaction.
Benefits for L1 Technicians:
- Asset Metrics Visibility: Access recent and historical views of CPU and Memory usage across flexible timeframes.
- Graphical Data Insights: Visualizations highlight performance spikes, trends, and potential bottlenecks.
- Faster Troubleshooting: Enables quicker root cause analysis and accelerates issue resolution for end-user performance problems.
Benefits for L3 Technicians:
- Event Contextualization: Provides visibility into system behavior leading up to and following monitoring alerts.
- Enhanced Validation: Makes it easier to confirm issues, reducing time spent on false positives.
- Pattern Identification: Supports deeper investigations by revealing trends and recurring behaviors around alert events.
Feature Highlights
- Configurable timeframes allowing the user to determine what timeframe to examine the metrics over – Last day by default, last hour, last 6 hours, last 2 days and last week
- Clear and concise visuals of how a device is performing allowing the user to spot spikes and trends
- Memory and CPU utilisation by default with more to follow – Use the ‘Feedback’ link on the Assets View to tell us which other metrics and info you would like to see!
UX Improvements to Assets View
We are also pleased to mention a couple of smaller but helpful updates to the Assets View, based on partner feedback. Now all columns can be resized and minimized down to a smaller size to aid readability and workflow.
We also improved the spacing on the Asset Details view for readability.
N-sight Specific Update: North Pane Asset Deeplink
The above updates apply to both N-sight and N-central partners. The following update is for N-sight partners. We are pleased to highlight that we are rolling out a new device name deeplink, so that it’s much easier to jump from the north pane straight to the device in Assets View, where you can see additional systems info, including the new CPU and Memory Usage metrics discussed above.

Simply click the link to open the Asset Details Panel for that device. Click on ‘All Devices’ top left to navigate back to the north pane. This update will be rolled out gradually over the next few days.
We’re excited to bring you these new capabilities and refinements, designed to improve metrics clarity, decision making, and workflow efficiency, and we look forward to you experiencing the impact firsthand.
You must be logged in to post a comment.